Historical Documents has been a great class this semester because I can use the methods that we are getting from the class and applying it. I posted earlier the transcribing exercise that I applied to the original handwritten manuscripts of Tolkien. This inspired me to use these skills of transcribing, census recording, and building a timeline of events to LOTR once again as a final paper/project. I am really excited to be doing this.
The two projects that I am posting today are the working with maps and census/working with numeral data exercises.
For the maps:
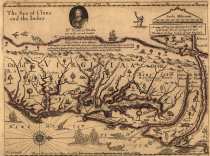
 I used four maps of Virginia, specifically around the Chesapeake Bay area and Jamestowne settlement from the years 1612 to 1755 and they are all printed maps. The first map is John Smith’s 1612 map of Virginia from his expedition in 1606-1607; second is John Farrer’s map of 1677 of the coast of
  Virginia for both the Atlantic and Pacific Oceans; third is a 1640 nautical map of parts of Virginia and parts of Florida written in Latin; and fourth is 1755 map of Virginia that includes North and South Carolina, Georgia, and Maryland with boundaries and properties marked to indicate territory possession.
The artwork is what interested me the most between these four maps. In John Smith’s map he has his artwork on the Natives, one a single Susquehannock man and a scene with Powhatan and other  individuals which are original drawings and contrasts from what it seems to be illustrations of Native from the 1640 map. Smith’s map is also has elaborate drawings of the plant life, building structures, and sea creatures in the Virginia Sea and the Chesapeake Bay. Farrer’s map follow suit with the drawings of fantasy sea creatures, as wells ships, plant and animal life, and there is also a picture and biography of Sir Francis Drake at the top. In contrast to the English maps, the 1640 map has differing images of angel babies, images of what is believed to be Natives, and ships.
  These three maps are thus contrasted to the 1755 map that does not have any expressive images, just terrain images and names of rivers and mountain ranges. It can be concluded that the early colonial maps were not just to map out the landscape, they were also works of art that was used as a way of storytelling to describe the fantasy aspect of the New World, almost to draw interest to come to the New World. As time progressed and the New World was being established, there wasn’t any need to draw interest to populate the area. The New World itself was not some idea and fantasy, it was an established land and very much real. Maps, in turn, were used more for political reasons to mark boundaries between the colonies, mark property of England, show the locations of Native tribes, and show the terrain of the landscape.
For Census
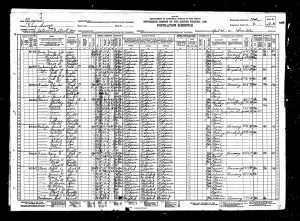
 I used two censuses, the 1910 and the 1930, from King George County, the Potomac District in Virginia. I specifically chose these two censuses because my family on my father’s side, the Clare’s, have been living in this area of Virginia since the late 1880s and continue to live in the same area generations later. I am also currently working on my family’s genealogy on both my parent’s sides of the family and my husband’s. Choosing these two censuses, I was able to compare and contrast various variables over a twenty year timeframe of the same area.
Comparing these two censuses, one can see that the 1930’s census has more detail than the 1910 but they both have very much the same categories. 1910 censuses have nine family households while the 1930 census has seven family households. One of the key differences that I saw between these two was in the ‘place of birth’ sections where in the 1910, almost half of the section is handwritten and the other half is stamped. In contrast, the 1930’s census, this section was all  handwritten. There is also a difference in the record of where Robert L Clare was born. In the 1910 census, he is recorded incorrectly to have born in Virginia and in the 1930 census he is correctly recorded to be born in Maryland. Another change that is evident is the growth of the family size that is seen in both censuses from 1910 to 1930 with the birth of children during the twenty year difference. For example, the Clare family in 1910 had four individuals and in 1930 there are ten individuals. In the 1930 census, the Clare family does have a black man that is described as family servant at the age 85. I did not see any other families with a servant in either census. The last major difference was the occupation changes with specifically Robert Clare from blacksmithing working at an auto shop to farming. Both of these occupations were true and the family still owns the auto shop and farm that are recorded. The 1910 had more detailed specialties of occupations than the 1930 and there is a lot more farming occupations in 1930 than in 1910. There are a couple of families that also on both of the census besides the Clare’s, these families include the Fines and the Washington’s.
I really enjoyed doing these projects. As I stated before, my plan is to take these methods and apply them to LOTR to reconstruct culture histories of the various races.
Leave a comment